We recently rewrote a piece of C++ that sends a few hundred small HTTPS requests at a time: DNS-over-HTTPS queries, binary POSTs of about 30 bytes, sent through HTTP proxies to a dozen public resolvers. The old code gave each request its own curl easy handle on a 50-thread pool. A batch of 630 requests opened 630 connections and took 10.3 seconds. The new code sends the same batch over 13 to 15 connections in 1.8 seconds.
The requests didn’t change. They now share HTTP/2 connections, which in libcurl takes a multi handle and one option that’s easy to miss.
Where the Time Actually Went
The old code looked like most libcurl code you’ll find:
CURL *c = curl_easy_init();

curl_easy_setopt(c, CURLOPT_URL, _url.c_str());
curl_easy_setopt(c, CURLOPT_HTTPHEADER, headers);
curl_easy_setopt(c, CURLOPT_POSTFIELDS, _body.data());
curl_easy_setopt(c, CURLOPT_POSTFIELDSIZE, static_cast<long>(_body.size()));

CURLcode res = curl_easy_perform(c);

curl_easy_cleanup(c);
That code already negotiated HTTP/2, since curl does by default over TLS. But the connection lives inside the easy handle, and curl_easy_cleanup() closes it, so every connection carried exactly one request.
For a 30-byte query, the request is the cheap part. Before it comes a CONNECT through the proxy, a TCP handshake and a full TLS handshake. With 50 threads firing at once, one server could see dozens of handshakes at the same moment, and median latency was 783ms for an exchange that takes about 25ms once a connection exists.
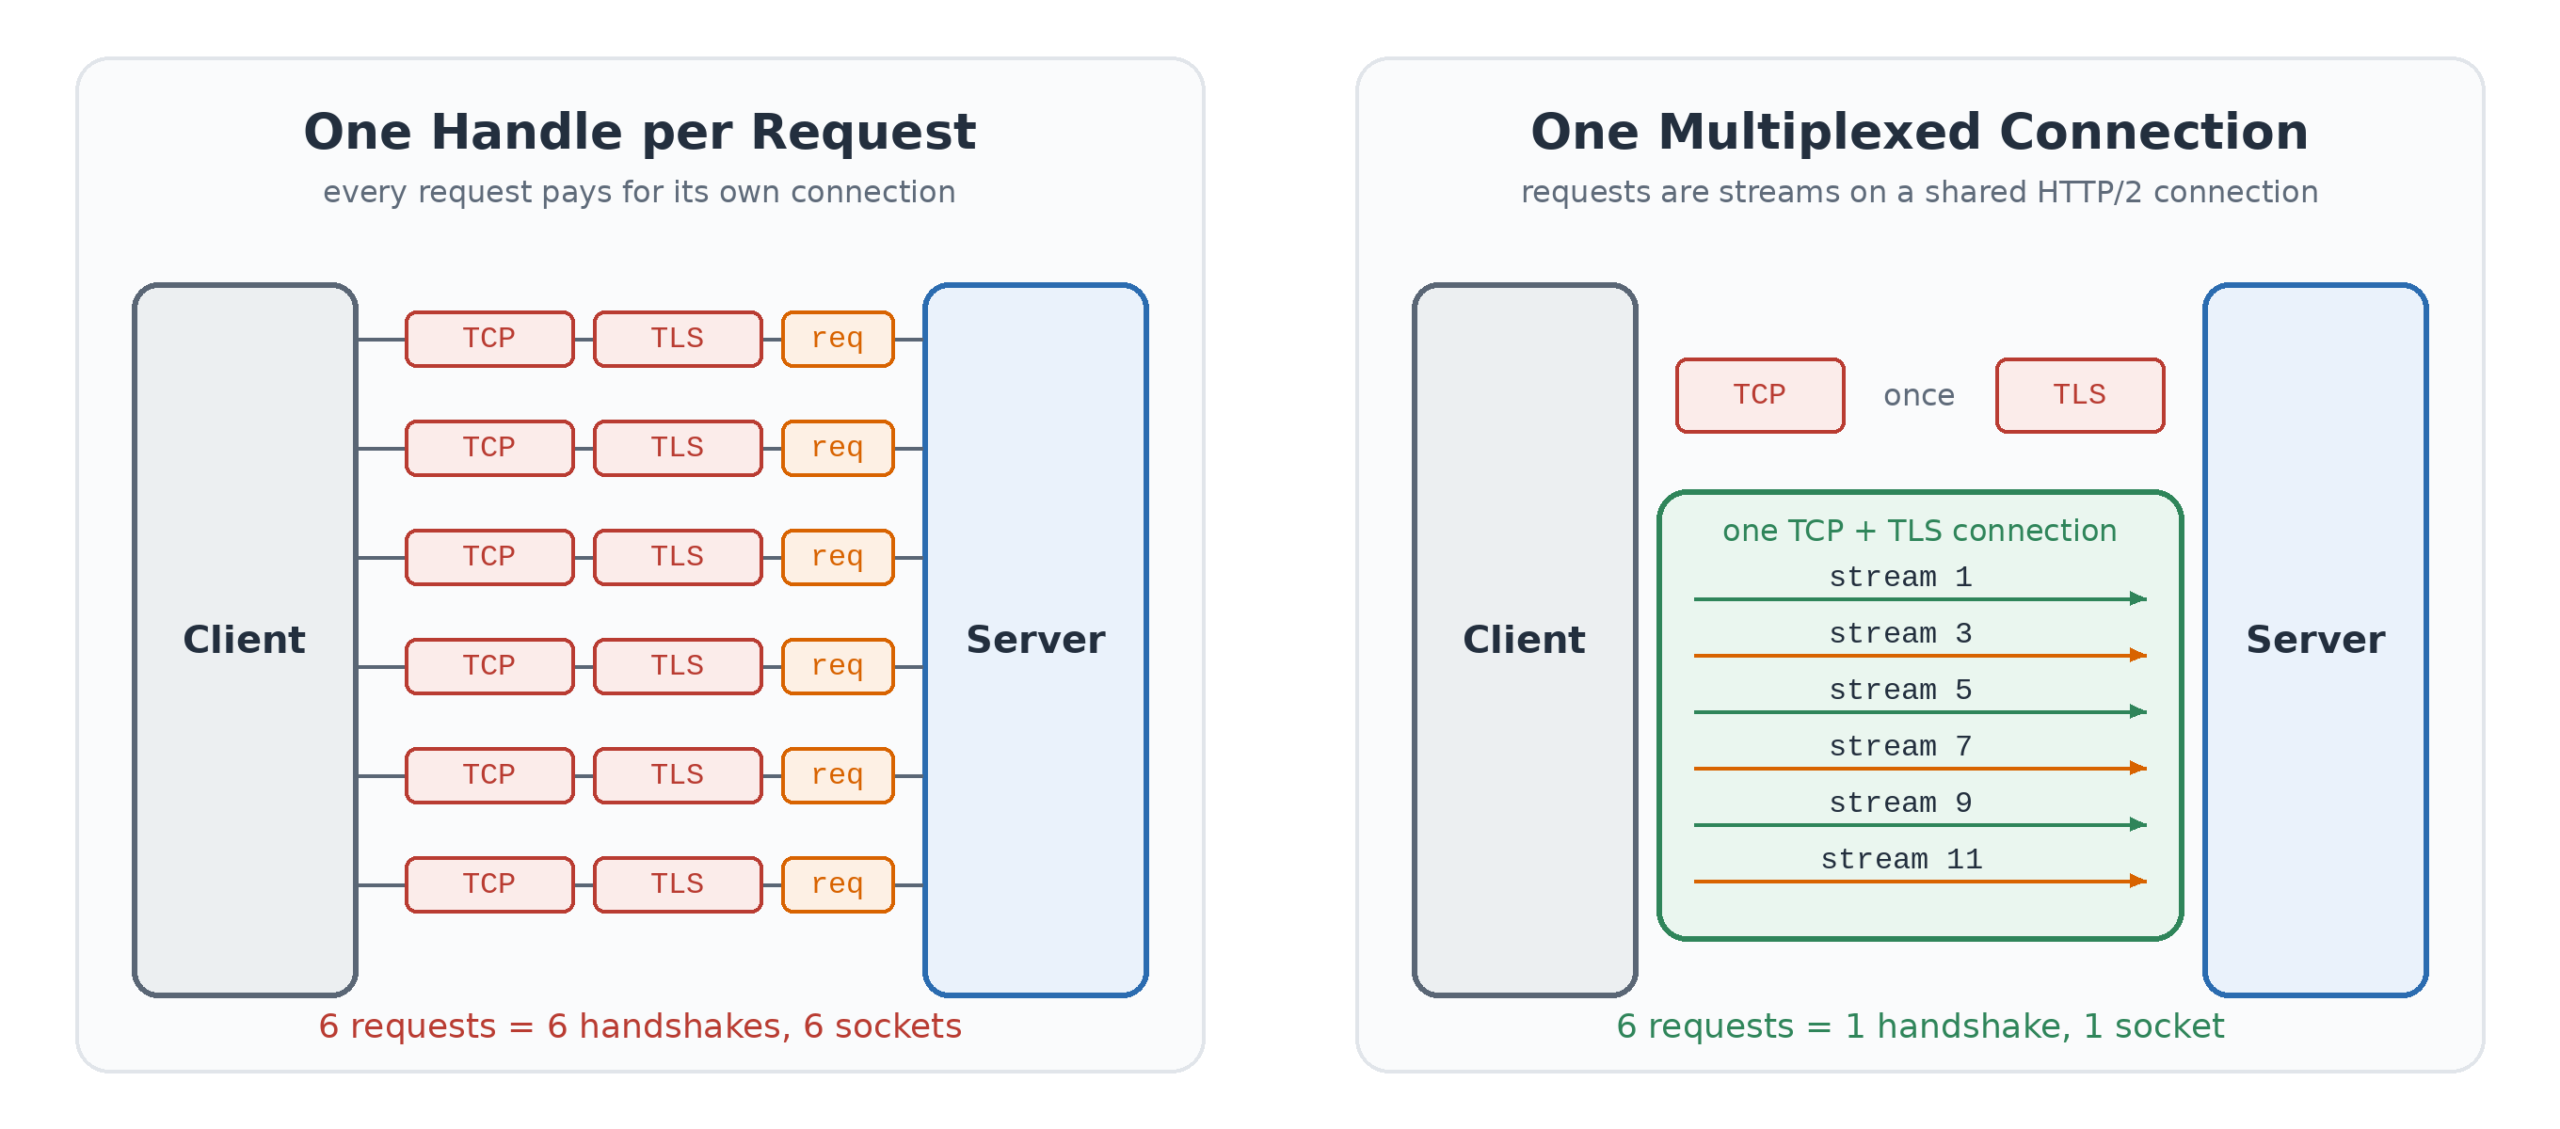
HTTP/2 fixes this. One connection carries many concurrent streams, and responses come back in whatever order they finish. You pay for the handshake once.
The Multi Handle Owns the Connections
To survive past one request, a connection has to outlive the easy handle. In libcurl that means the multi handle, which keeps a connection cache. Any transfer added to it can use a connection an earlier one opened, including one still busy with other streams.
CURLM *multi = curl_multi_init();

//
// streams on one connection; this has been the default since 7.62.0,
// but I'd rather the code say it
//
curl_multi_setopt(multi, CURLMOPT_PIPELINING, CURLPIPE_MULTIPLEX);

//
// at most 4 connections per host, and room in the cache for all of them
//
curl_multi_setopt(multi, CURLMOPT_MAX_HOST_CONNECTIONS, 4L);
curl_multi_setopt(multi, CURLMOPT_MAXCONNECTS, 64L);
2 and 4 connections per host performed about the same. I kept 4 as headroom in case a server limits concurrent streams per connection. MAXCONNECTS only needs room for every host’s connections, and we talk to about 12 hosts.
Easy handles are still created per request and freed afterwards. Pooling them buys nothing now that the connection lives in the multi handle.
CURL *c = curl_easy_init();

curl_easy_setopt(c, CURLOPT_URL, _req->url.c_str());
curl_easy_setopt(c, CURLOPT_HTTPHEADER, headers);
curl_easy_setopt(c, CURLOPT_POSTFIELDS, _req->body.data());
curl_easy_setopt(c, CURLOPT_POSTFIELDSIZE, static_cast<long>(_req->body.size()));
curl_easy_setopt(c, CURLOPT_TIMEOUT, 5L);
curl_easy_setopt(c, CURLOPT_NOSIGNAL, 1L);
curl_easy_setopt(c, CURLOPT_WRITEFUNCTION, write_cb);
curl_easy_setopt(c, CURLOPT_WRITEDATA, _req);

//
// hand the request back to us when the transfer completes
//
curl_easy_setopt(c, CURLOPT_PRIVATE, _req);

//
// if a connection to this host is still negotiating, wait for it to confirm h2
//
curl_easy_setopt(c, CURLOPT_PIPEWAIT, 1L);

curl_multi_add_handle(multi, c);
PIPEWAIT Is the Option That Matters
This one caught me. Without CURLOPT_PIPEWAIT, a burst of requests to a host with no open connection doesn’t multiplex. curl can’t know the server speaks HTTP/2 until the first TLS handshake finishes and ALPN says “h2”, so until then every new request sees no usable connection and opens its own. By the time the first one confirms h2, all fifty have one.
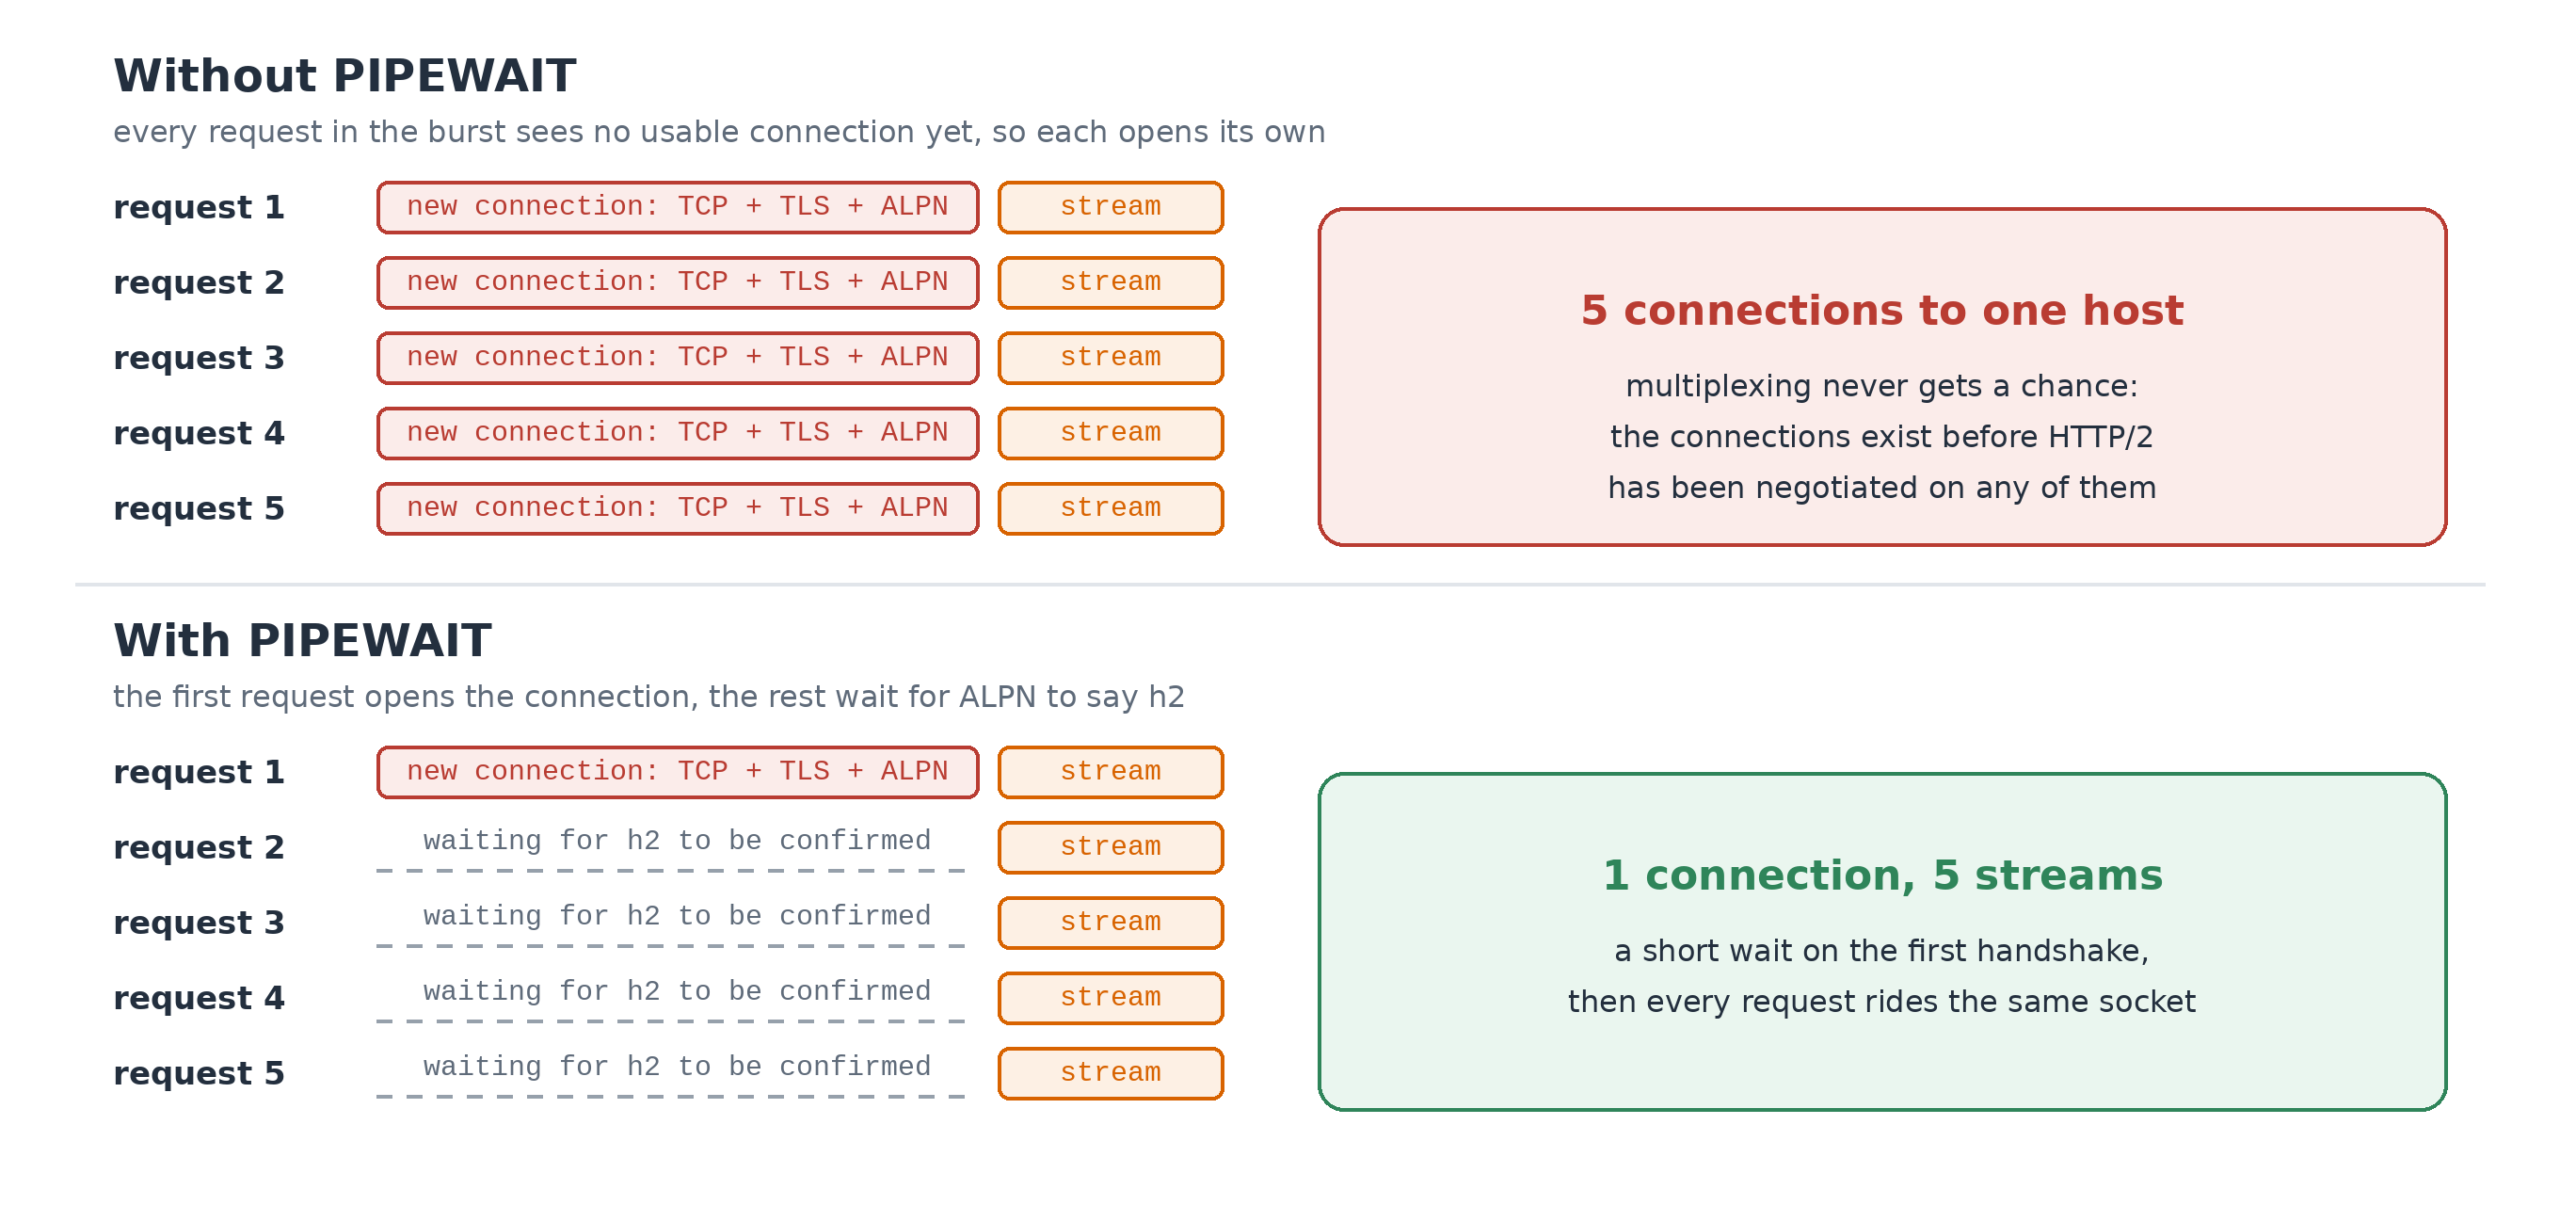
With PIPEWAIT set, curl holds those requests until the first connection confirms or denies multiplexing, then puts them on it as streams. To check, I ran the example program from the end of this post: 200 queries to Cloudflare’s DoH endpoint, 50 in flight, counting new connections with CURLINFO_NUM_CONNECTS.
| PIPEWAIT |
MAX_HOST_CONNECTIONS |
New connections |
| off |
unlimited (0) |
50 |
| off |
4 |
4 |
| on |
unlimited (0) |
1 |
| on |
4 |
1 |
Without it, multiplexing is enabled and never used. The host cap only limits the damage.
One Thread Talks to curl
A multi handle isn’t thread-safe, and I didn’t want to turn every caller into a callback. So one I/O thread owns the multi handle and nothing else touches curl. Worker threads keep their blocking code: push a request onto a queue, wake the I/O thread, wait on a condition variable.
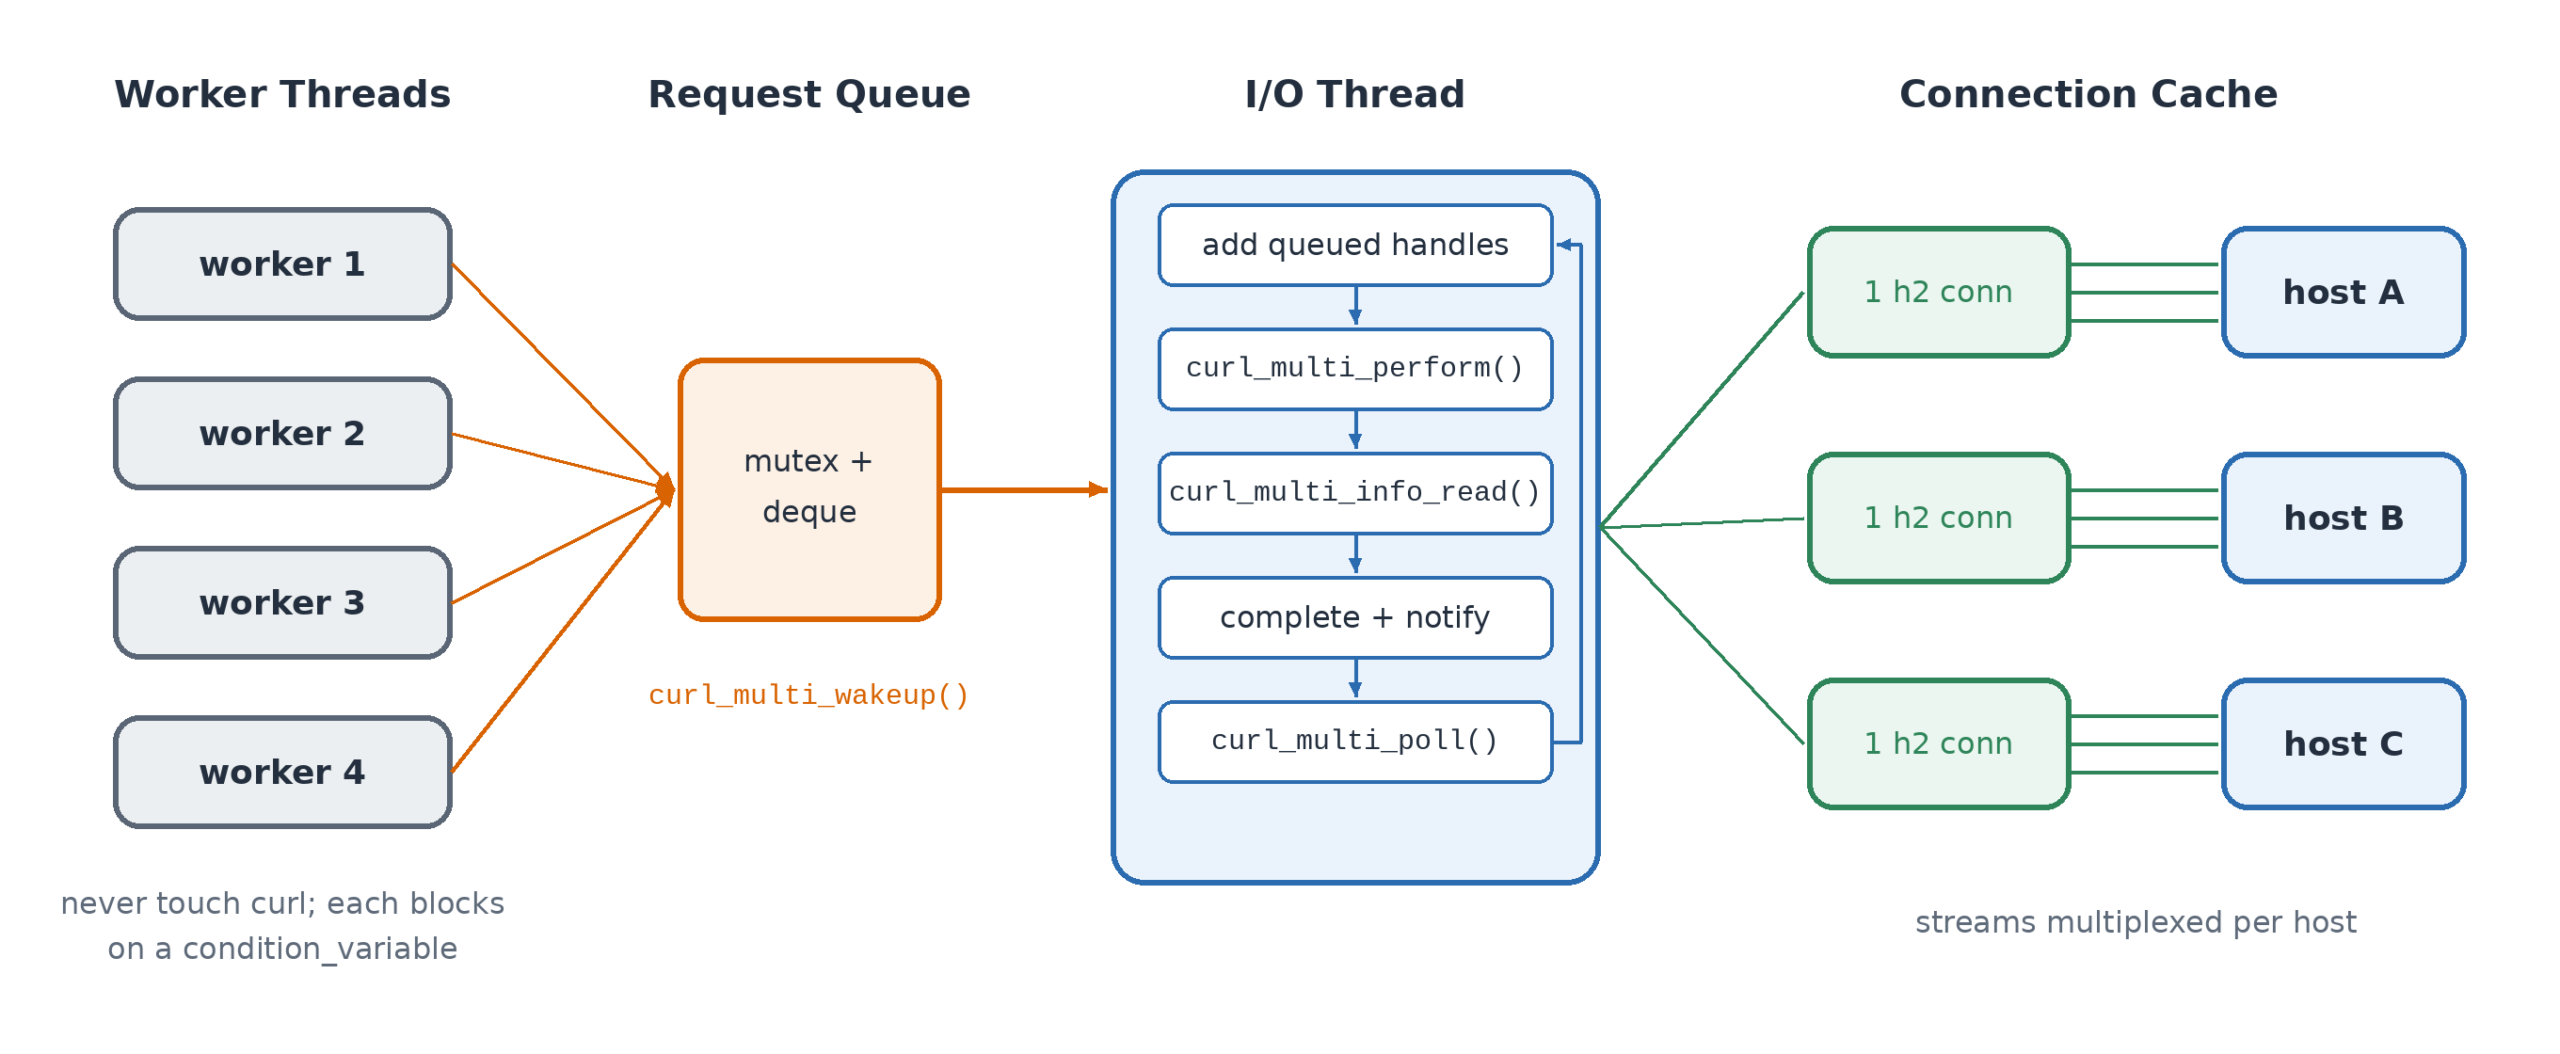
The loop is curl_multi_perform() plus curl_multi_poll(). curl_multi_socket_action() with epoll scales to far more sockets, but this program has about 15 open. Poll is plenty.
for (;;)
{
    //
    // start anything the workers have queued; m_running is checked under
    // the same lock that submit() and shutdown use
    //
    {
        std::lock_guard<std::mutex> guard(this->m_queue_lock);

        if (this->m_running == false)
        {
            break;
        }

        while (this->m_queue.empty() == false)
        {
            this->_start(this->m_queue.front());
            this->m_queue.pop_front();
        }
    }

    int still_running = 0;
    curl_multi_perform(this->m_multi, &still_running);

    //
    // harvest completed transfers
    //
    int left = 0;
    CURLMsg *msg = nullptr;

    while ((msg = curl_multi_info_read(this->m_multi, &left)) != nullptr)
    {
        if (msg->msg != CURLMSG_DONE)
        {
            continue;
        }

        request_t *req = nullptr;

        curl_easy_getinfo(msg->easy_handle, CURLINFO_PRIVATE, &req);
        curl_easy_getinfo(msg->easy_handle, CURLINFO_RESPONSE_CODE, &req->http_code);
        req->result = msg->data.result;

        curl_multi_remove_handle(this->m_multi, msg->easy_handle);
        curl_easy_cleanup(msg->easy_handle);

        this->_complete(req);
    }

    //
    // sleep until there's socket activity, a timeout, or curl_multi_wakeup()
    //
    curl_multi_poll(this->m_multi, nullptr, 0, 1000, nullptr);
}
curl_multi_wakeup() is safe to call from any thread and interrupts a sleeping curl_multi_poll() immediately, so a new request joins a connection while other streams are still running on it. The producer side:
void cpool::submit(request_t *_req)
{
    {
        std::lock_guard<std::mutex> guard(this->m_queue_lock);

        if (this->m_running == false)
        {
            this->_fail(_req);
            return;
        }

        this->m_queue.push_back(_req);

        //
        // under the same lock shutdown takes before curl_multi_cleanup()
        //
        curl_multi_wakeup(this->m_multi);
    }

    std::unique_lock<std::mutex> lk(_req->lock);
    _req->cv.wait(lk, [_req] { return _req->done == true; });
}
The comment in there is about a real bug. A producer calling curl_multi_wakeup() while shutdown is inside curl_multi_cleanup() is a use-after-free, and taking the queue lock for both closes it. At shutdown, curl_multi_get_handles() (libcurl 8.4 and later) lists the transfers still in flight, so you can fail them and no worker waits forever.
The Numbers
Same machine, same batch, same HTTP CONNECT proxies, about 12 public DoH endpoints, at most 50 requests in flight:
| Run |
Requests |
New connections |
p50 |
p95 |
Wall time |
| Easy handle per request, 50 threads |
630 |
630 |
783ms |
1058ms |
10.3s |
| Multi handle, multiplexed (2 runs) |
630 |
13 to 15 |
22 to 27ms |
250 to 295ms |
1.8s |
| Multi handle, multiplexed |
1,260 |
16 |
27ms |
279ms |
3.4s |
These are single runs from one environment, so treat the latencies as illustrative. The connection counts will hold anywhere: doubling the batch to 1,260 requests needed 16. I didn’t measure CPU or memory, though 615 fewer TLS handshakes can’t have hurt.
The p95 dropped far less than the median. The tail is mostly slow resolvers, and multiplexing can’t make a slow server answer faster.
One result surprised me. With a handshake per request, one public endpoint refused a share of them through one of our proxies: 13.3% of requests failed in one run and 7.7% in another, with SSL connect error and Send failure: Broken pipe. Multiplexed, 0 of 600 failed. Without the proxy, the per-request test had no failures either, so it depended on the path the traffic took. I don’t know the server’s rule, but dozens of simultaneous handshakes from one address is exactly the pattern that trips one.
When the Server Only Speaks HTTP/1.1
None of this code asks for HTTP/2. curl offers h2 and http/1.1 in ALPN and the server picks. If it picks HTTP/1.1, nothing errors: PIPEWAIT releases the waiting requests, and each one needs a connection of its own.
The multi handle still reuses HTTP/1.1 connections, so this beats the old code. But an HTTP/1.1 connection carries one request at a time, which turns the connection cap into a concurrency cap. At 4, only 4 requests to that host run at once and the rest queue inside curl.
Per the curl docs, a queued transfer is already counting down its CURLOPT_TIMEOUT. I pointed the example at a local HTTPS server that offers only HTTP/1.1 in ALPN, sent 200 requests with 50 in flight, and had it take 50ms or 500ms per response:
| Server response time |
MAX_HOST_CONNECTIONS |
Connections |
Timed out |
| 50ms |
4 |
4 |
0 of 200 |
| 50ms |
unlimited (0) |
50 |
0 of 200 |
| 500ms |
4 |
51 |
117 of 200 |
| 500ms |
unlimited (0) |
50 |
0 of 200 |
At 50ms, 4 connections keep up. At 500ms they manage 8 requests a second, and the 5-second timeout runs out on requests that never got a connection. Each timeout also closes the connection it was using, which is why that row opened 51. A cap sized for HTTP/2, where each connection carries up to 100 streams by default, is far too small for a server that falls back.
The cap covers every host on the multi handle, so you can’t raise it for one. You can find out which hosts fell back, though. CURLINFO_HTTP_VERSION reports what was negotiated:
long version = 0;

curl_easy_getinfo(msg->easy_handle, CURLINFO_HTTP_VERSION, &version);

//
// the server picked HTTP/1.1 in ALPN; this host can't multiplex
//
if ((req->result == CURLE_OK) && (version != CURL_HTTP_VERSION_2_0))
{
    fprintf(stderr, "%s negotiated HTTP/1.x, no multiplexing\n", req->url.c_str());
}
For an HTTP/1.1-only host you have to keep, give it its own multi handle with a higher cap, or a timeout that covers the time spent queued.
What Goes Wrong
Proxies split the connection pool. curl keys cached connections on the proxy as well as the host, since a tunnel through proxy A can’t carry a request for proxy B. Pick a proxy at random per request and requests to the same server land on different connections, and multiplexing quietly stops. We pin each destination host to one proxy and move it only after a connection-level failure.
Streams share fate. When a connection dies, every stream on it dies too. We saw Error in the HTTP2 framing layer and Failed sending data to the peer take out 6 to 8 requests at once. Per-request retries are no longer optional. Ours retries once after moving the host to another proxy, and in testing every retry succeeded.
Don’t force HTTP/1.1 to make an error go away. We tried it while debugging. One DoH server answered 505 HTTP Version Not Supported and two others refused the TLS negotiation. Plenty of DoH servers only speak h2.
The write callback has to be binary safe. A DNS response is full of NUL bytes, and a callback that treats the buffer as a C string truncates it without complaint:
static size_t write_cb(char *_ptr, size_t _size, size_t _nmemb, void *_data)
{
    //
    // append with a length; never strcat() or std::string(_ptr)
    //
    static_cast<request_t *>(_data)->response.append(_ptr, _size * _nmemb);

    return _size * _nmemb;
}
Idle connections expire. curl won’t reuse a connection idle longer than CURLOPT_MAXAGE_CONN, 118 seconds by default, so after a quiet stretch the next burst pays one handshake per host. Worth knowing if your traffic arrives in bursts minutes apart.
You need nghttp2. CURLPIPE_MULTIPLEX does nothing if libcurl was built without HTTP/2. If the curl tool uses the same library, curl --version should list HTTP2 under Features. curl_multi_poll() and curl_multi_wakeup() need 7.68.0 or later. Everything here ran on libcurl 8.18.0 with nghttp2 1.43.0.
A Complete Example
A stripped-down version you can compile and run. It sends A queries for example.com to Cloudflare’s DoH endpoint from a pool of worker threads and counts new connections. Build it with g++ -std=c++23 -O2 h2mux.cpp -o h2mux -lcurl, run ./h2mux 200 50, then comment out the PIPEWAIT line and run it again.
#include <stdio.h>
#include <stdlib.h>
#include <string>
#include <vector>
#include <deque>
#include <mutex>
#include <condition_variable>
#include <thread>
#include <atomic>
#include <curl/curl.h>

struct request_t
{
    std::string url;
    std::string body;
    std::string response;
    long http_code = 0;
    CURLcode result = CURLE_OK;
    bool done = false;
    std::mutex lock;
    std::condition_variable cv;
};

static std::mutex g_queue_lock;
static std::deque<request_t *> g_queue;
static bool g_running = true;
static long g_connects = 0;
static CURLM *g_multi = nullptr;
static curl_slist *g_headers = nullptr;

static size_t write_cb(char *_ptr, size_t _size, size_t _nmemb, void *_data)
{
    static_cast<request_t *>(_data)->response.append(_ptr, _size * _nmemb);
    return _size * _nmemb;
}

//
// a minimal DNS query in wire format: header, then QNAME, QTYPE A, QCLASS IN
//
static std::string dns_query(const std::string &_name)
{
    std::string q("\x00\x00\x01\x00\x00\x01\x00\x00\x00\x00\x00\x00", 12);
    size_t start = 0;

    while (start < _name.size())
    {
        size_t dot = _name.find('.', start);
        if (dot == std::string::npos)
        {
            dot = _name.size();
        }

        q += static_cast<char>(dot - start);
        q += _name.substr(start, dot - start);
        start = dot + 1;
    }

    q += std::string("\x00\x00\x01\x00\x01", 5);
    return q;
}

static void start(request_t *_req)
{
    CURL *c = curl_easy_init();

    curl_easy_setopt(c, CURLOPT_URL, _req->url.c_str());
    curl_easy_setopt(c, CURLOPT_HTTPHEADER, g_headers);
    curl_easy_setopt(c, CURLOPT_POSTFIELDS, _req->body.data());
    curl_easy_setopt(c, CURLOPT_POSTFIELDSIZE, static_cast<long>(_req->body.size()));
    curl_easy_setopt(c, CURLOPT_TIMEOUT, 5L);
    curl_easy_setopt(c, CURLOPT_NOSIGNAL, 1L);
    curl_easy_setopt(c, CURLOPT_WRITEFUNCTION, write_cb);
    curl_easy_setopt(c, CURLOPT_WRITEDATA, _req);
    curl_easy_setopt(c, CURLOPT_PRIVATE, _req);
    curl_easy_setopt(c, CURLOPT_PIPEWAIT, 1L);

    curl_multi_add_handle(g_multi, c);
}

static void io_thread()
{
    for (;;)
    {
        {
            std::lock_guard<std::mutex> guard(g_queue_lock);

            if (g_running == false)
            {
                break;
            }
            while (g_queue.empty() == false)
            {
                start(g_queue.front());
                g_queue.pop_front();
            }
        }

        int still_running = 0;
        curl_multi_perform(g_multi, &still_running);

        int left = 0;
        CURLMsg *msg = nullptr;

        while ((msg = curl_multi_info_read(g_multi, &left)) != nullptr)
        {
            if (msg->msg != CURLMSG_DONE)
            {
                continue;
            }

            request_t *req = nullptr;
            long connects = 0;

            curl_easy_getinfo(msg->easy_handle, CURLINFO_PRIVATE, &req);
            curl_easy_getinfo(msg->easy_handle, CURLINFO_RESPONSE_CODE, &req->http_code);
            curl_easy_getinfo(msg->easy_handle, CURLINFO_NUM_CONNECTS, &connects);
            req->result = msg->data.result;
            g_connects += connects;

            curl_multi_remove_handle(g_multi, msg->easy_handle);
            curl_easy_cleanup(msg->easy_handle);

            std::lock_guard<std::mutex> guard(req->lock);
            req->done = true;
            req->cv.notify_one();
        }

        curl_multi_poll(g_multi, nullptr, 0, 1000, nullptr);
    }
}

static void submit(request_t *_req)
{
    {
        std::lock_guard<std::mutex> guard(g_queue_lock);

        g_queue.push_back(_req);
        curl_multi_wakeup(g_multi);
    }

    std::unique_lock<std::mutex> lk(_req->lock);
    _req->cv.wait(lk, [_req] { return _req->done == true; });
}

int main(int _argc, char **_argv)
{
    int total = (_argc > 1) ? atoi(_argv[1]) : 100;
    int threads = (_argc > 2) ? atoi(_argv[2]) : 20;

    curl_global_init(CURL_GLOBAL_DEFAULT);

    g_multi = curl_multi_init();
    curl_multi_setopt(g_multi, CURLMOPT_PIPELINING, CURLPIPE_MULTIPLEX);
    curl_multi_setopt(g_multi, CURLMOPT_MAX_HOST_CONNECTIONS, 4L);
    curl_multi_setopt(g_multi, CURLMOPT_MAXCONNECTS, 64L);

    g_headers = curl_slist_append(g_headers, "Content-Type: application/dns-message");
    g_headers = curl_slist_append(g_headers, "Accept: application/dns-message");

    std::thread io(io_thread);

    std::vector<request_t> reqs(total);
    for (auto &r : reqs)
    {
        r.url = "https://cloudflare-dns.com/dns-query";
        r.body = dns_query("example.com");
    }

    //
    // workers block on one request at a time, exactly like the old code
    //
    std::atomic<int> next{0};
    std::vector<std::thread> workers;

    for (int t = 0; t < threads; t++)
    {
        workers.emplace_back([&]
        {
            int i;
            while ((i = next++) < total)
            {
                submit(&reqs[i]);
            }
        });
    }
    for (auto &w : workers)
    {
        w.join();
    }

    int ok = 0;
    for (auto &r : reqs)
    {
        if ((r.result == CURLE_OK) && (r.http_code == 200))
        {
            ok++;
        }
    }

    {
        std::lock_guard<std::mutex> guard(g_queue_lock);

        g_running = false;
        curl_multi_wakeup(g_multi);
    }
    io.join();

    curl_multi_cleanup(g_multi);
    curl_slist_free_all(g_headers);
    curl_global_cleanup();

    printf("%d/%d ok, connections opened: %ld\n", ok, total, g_connects);
    return 0;
}
Here it prints 200/200 ok, connections opened: 1. Without PIPEWAIT it opens 4, and with the host cap removed as well it opens 50.